(This article was first published on Statistical Research » R, and kindly contributed to R-bloggers)
This is a brief description on one way to determine the distribution of given data. There are several ways to accomplish this in R especially if one is trying to determine if the data comes from a normal distribution. Rather than focusing on hypothesis testing and determining if a distribution is actually the said distribution this example shows one simple approach to determine the parameters of a distribution. I’ve found this useful when I’m given a dataset and I need to generate more of the same type of data for testing and simulation purposes.
Image may be NSFW.
Clik here to view.
raw < - t( matrix(c(
1, 0.4789,
1, 0.1250,
2, 0.7048,
2, 0.2482,
2, 1.1744,
2, 0.2313,
2, 0.3978,
2, 0.1133,
2, 0.1008,
1, 0.7850,
2, 0.3099,
1, 2.1243,
2, 0.3615,
2, 0.2386,
1, 0.0883), nrow=2
) )
( fit.distr <- fitdistr(raw[,2], "gamma") )
qqplot(rgamma(nrow(raw),fit.distr$estimate[1], fit.distr$estimate[2]), (raw[,2]),
xlab="Observed Data", ylab="Random Gamma")
abline(0,1,col='red')

simulated <- rgamma(1000, fit.distr$estimate[1], fit.distr$estimate[2])
hist(simulated, main=paste("Histogram of Simulated Gamma using",round(fit.distr$estimate[1],3),"and",round(fit.distr$estimate[2],3)),
col=8, xlab="Random Gamma Distribution Value")

( fit.distr <- fitdistr(raw[,2], "normal") )
qqplot(rnorm(nrow(raw),fit.distr$estimate[1], fit.distr$estimate[2]), (raw[,2]))
abline(0,1,col='red')

( fit.distr <- fitdistr(raw[,2], "lognormal") )
qqplot(rlnorm(nrow(raw),fit.distr$estimate, fit.distr$sd), (raw[,2]))
abline(0,1,col='red')

( fit.distr <- fitdistr(raw[,2], "exponential") )
qqplot(rexp(nrow(raw),fit.distr$estimate), (raw[,2]))
abline(0,1,col='red')
Image may be NSFW.
Clik here to view.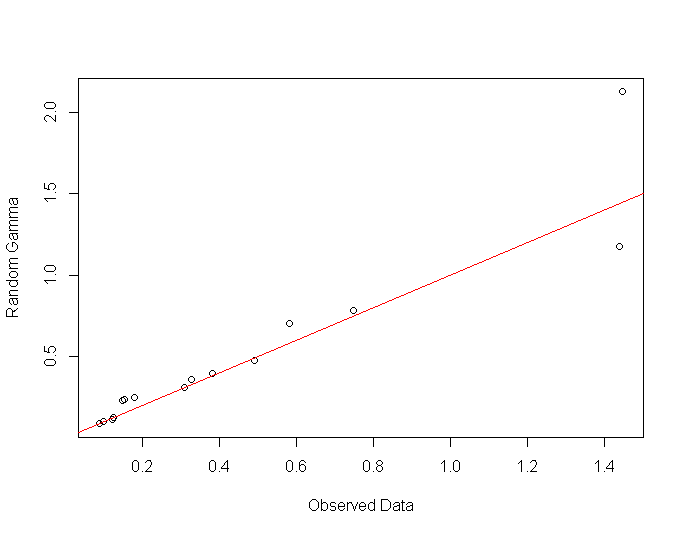
To leave a comment for the author, please follow the link and comment on his blog: Statistical Research » R.
R-bloggers.com offers daily e-mail updates about R news and tutorials on topics such as: visualization (ggplot2, Boxplots, maps, animation), programming (RStudio, Sweave, LaTeX, SQL, Eclipse, git, hadoop, Web Scraping) statistics (regression, PCA, time series,ecdf, trading) and more...